Concept
Manufacturing tools have been available for many years now. As a result a certain number of concepts have emerged and are shared by most of the manufacturing tools in particular the optimization engines for manufacturing.
Activities
We call an activity what others call a task. It has:
- a start time
- a duration
Some times the duration can be a function of the start time, which is why we use (start, duration) instead of (start, end) where this relation would be more complex to model.

Activities of duration 0 are called milestones
Sequences
A sequence is "someone or something that can perform activities". Think a machine, a person.

Important
- An activity can belong to multiple sequences (obviously they are “simultaneous” because the start time and length is a property of the activity itself). Think “two people working on the same task”.
- A sequence can perform multiple activities simultaneously. Think a machine that has multiple conveyor belts.
(Cumulative) resources
A cumulative resource models the fact that activities "consume" things
- usage of a tool by a machine
- transformation of raw materials into finished products (inventory)
Example : availability of a tool
This cumulative resource represent the availability of a tool
- 1 when the tool is available
- 0 when the tool is used

The cumulative function is mathematically described by
- 1 – sum (a in activities) pulse(a)
- pulse(a) is the function = 1 during the duration of the activity a
Example: inventory of raw and finished materials
These 2 cumulative resources represent the raw material and finished product inventory

These cumulative functions are mathematically described by
- Initial_inventory – sum(a in activities) consumption[a] * step_at_start(a)
- Initial_inventory + sum (a in activities) production[a] * step_at_end(a)
- step_at_start (a) is a function = 0 before start(a) and 1 after
- step_at_end (a) is a function = 0 before end(a) and 1 after

Some docs write stepAtEnd(a, h) instead of h * stepAtEnd(a)
Important
- Cumulative resources are NOT linked to sequences, only to activities. We can have resources that span multiple sequences for instance.
- availability of a tool shared by many workers.
- inventory of raw material for all the machines in the shop.
- Cumulative resources are just a function of some activities with potentially variable start and duration.
State resources
A state resource models the fact that some activities need a machine to be in a given state.
- Baking a material needs the oven to be at the right temperature
- A sanitary inspection needs the inspector to be there
A state resource has an internal state and transition rules
- The oven can only increase temperature by 10 degrees per minute and needs 15 minutes stabilization before it’s ready to be used
- An inspector has a state “location” and there is a minimum time to move between any pair of locations
Typical rules are:
- minimum / maximum duration of a state
- minimum duration between states
- permitted transitions between states (after A you can go to B or C)
States of duration 0 are called milestones
There is a default “unknown” state named “unknown” or 0 to avoid messing things up (imagine a set of rules that cannot be mathematically verified because they are contradictory. In that case it’s useful to have the “unknown” state).0
Rules are usually NOT represented visually because it would be too specific. Only the current state is represented, most of the time as a color.

The activities are said to require a state at start, end or during all their duration.
Albeit states are a kind of sequence, most of the time they are not represented as a single line with activities but as a background color over an existing sequence.

A complete example
Our Gantt App shows all the concepts together working interactively

Each line is a sequence and can have multiple activities (but no simultaneously here)
The blue line is a cumulative resource, here the sum of pulse(a) for all present activities
The background color is a state resource, here blue, white (default) or red
- blue when the cumulative resource is over the black reference
- white when the two lines are equal
- red when the blue line is below the black reference
You can play with the app online and all concepts at work
- Drag & drop an activity from the top to insert
- Move activities between sequences or change start time
- Drag outside of the gantt (above, below) to delete an activity
Purpose of the project
The Gantt app shows all the concepts at work but has a certain number of flaws
- Everything is hard coded
- Its missing minor manufacturing features (precedences)
- Its missing usability features (zoom, activity titles, resize of sequences when an activity is moved and it overlaps another one, freeze, etc)
- It is ugly per manufacturing standards
The purpose of the project is to make a library / widget
- That I can easily configure for multiple use cases
- That fixes most of the issues of the prototype
Examples of real industry gantts
Let’s review some examples of the gantts that I have to be able to recreate with the widget
Example 1 : employees activities

Typical gantt to manage employees in a facility
- light gray background is the
availablestate - notice the state is per employee = sequence and drawn as a background color
- activities have a type (supervision, admin, management, etc), dark gray activity means unknown / idle type
- cumulative resource is
- blue : sum of pulse of all pink activities
- yellow : sum of pulse of all dark grey activities
- the chart had the ability to stack and drill down per activity type
That horrendous Gantt is from my former employer in Singapore. I did the concept and a java programmer did the implementation. For what it’s worth, I ended resigning due to "disagreements with management about the investments to be done in the software".
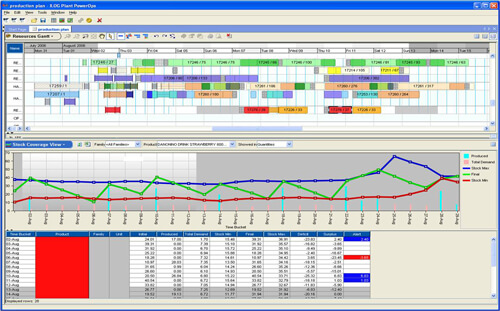
Example 2 : Manufacturing plant

This gantt shows an cumulative resource that is the inventory of finished goods (in green) and two reference lines called the “corridor”. The purpose of the tool is to help the planner make a production plan that ensures the finished goods remain between the two limits
The light blue bars show the end of the production activities (step_at_end(a)). Notice how every time there is a light blue bar, the green curve increases. The pink bars is the consumption of the inventory. Notice how every time there is a pink bar, the green curve decreases.

The inventory curve here is mathematically described by
- initial_inventory – sum (t in time) consumption[t] * step_at_time(t) + sum (a in production_activities) step_at_end(a)
- where step_at_time(t) is a function that is = to 1 at time t, 0 otherwise
Gantt
In the Gantt the most visible features are
- The two level time horizon
- Frozen activities

Time horizon
Most of the times the time “natural units” do not fit into the next level : 4 weeks don’t feet into a month, 52 weeks don’t fit in a year, 8 hours shifts don’t fit in business opening times (8h to 18h), etc. Thereafter you need a 2 level time axis
Frozen activities
There are a lot of activities which position and duration is frozen and the planner cannot move them. Tank cleaning is one of them for hygiene reasons. Planned maintenance is another one. All these activities are represented as brick-wall textured activity over a gray background. The height of the activity is also slightly reduced to ease identifying them.

The planner can also manually freeze other activities to make sure he won’t move them around by mistake. In that case a brick (transparent) texture appears on top of the existing activity

There are two ways to freeze :
- right click and contextual button
- multiple select with shift + icon “freeze all” on icon menu
Another version of the same manufacturing tool.

Notice how some sequences have double lines because of simultaneous activities

We also see precedences for highlighted / selected activities

There are too many precedences in a production planning instance in order to show them all. A manufacturing process is typically a succession of activities performed on different machines

Remember precedences are transitive so technically speaking there is a precedence between any two pair of activities that cannot be simultaneous

There are precedences everywhere in this process. What is typically done is precedences are only represented
- Between successive activities
- Of different sequences
- When highlighted / selected or on drag & drop
- With a parameter to control “precedence verbosity”

We also had a mode “show all direct precedences of selected activity” with multiple select

Precedences can be on activity start or activity end : startAfterStart(A, B), startAfterEnd(A,B), endAfterStart(A, B), endAfterEnd(A, B)

Same tool, this time we see
- Side by side mode
- Milestones represented as a triangle

Milestones are typically used to represent the beginning or end of a process (that is a group of activities linked together like a production batch of yoghurt).
For more details about the manufacturing tool I use to work on http://www.kstec.co.kr/download/docs/wp-ppo.pdf
Zoom levels
Manufacturing is a very broad problem. Plants can be very manual or completely automated depending on the industry and their location

Each person here is a “sequence” doing different activities

This is also a manufacturing plant
Based on the type of goods manufactured, the physical nature of the “machines” and the level of details the customer wants to model his problem, manufacturing problems can have a different “natural” zoom level
Human workers are managed on a daily to weekly horizon

- Labor constraints limit daily working time, there is a typical “gliding window” shape
- There are overlaps (for people to agree when a process changes of worker) and idle times due to breaks, lunch time, etc.
- Activities are sliced into small buckets and change often because people cannot do the same thing for 8h straight.
- Activities have a minimum duration (usually 15 minutes) because people don’t like to do something for just a couple of minutes and immediately change
- Activities tend to have lengths that are multiple of 1h or 30 minutes because it’s easier for humans to manage
- Productivity is very variable ; the tool needs to capture past productivity measures, do some statistics and use that to forecast productivity
When a company / plant wants to manage humans in a longer time period (monthly) the problem is modeled at a “shift level” meaning we make the approximation a person does the same thing for the whole 8h shift like “sewing”, “inventory”, “receiving goods”, “quality inspection”.

- The tool needs to manage days off and vacations
- The tool needs to manage the labor regulation logic (leave enough time for sleep between shifts, weekends and overnight shifts are more expensive, etc)
Machines have a larger range of time horizons because they can indifferently do the same work for 42 days straight or change activities every minute if required.
- We NEVER do unreasonable things like modeling a problem down to 1 minute activities and then try to visualize a schedule for a full year with 10 million activities in it.
- There is a “span” concept we use for large zoom in / out, I think it is better to leave it for a subsequent iteration
Span concept
When working with machines sometimes we want to visualize at a very large zoom out a process that we have defined at a very high granularity. To avoid blowing up visualization tool, we typically define “super activities” names span activities
